
Profiling PyTorch Models: Bottleneck Analysis
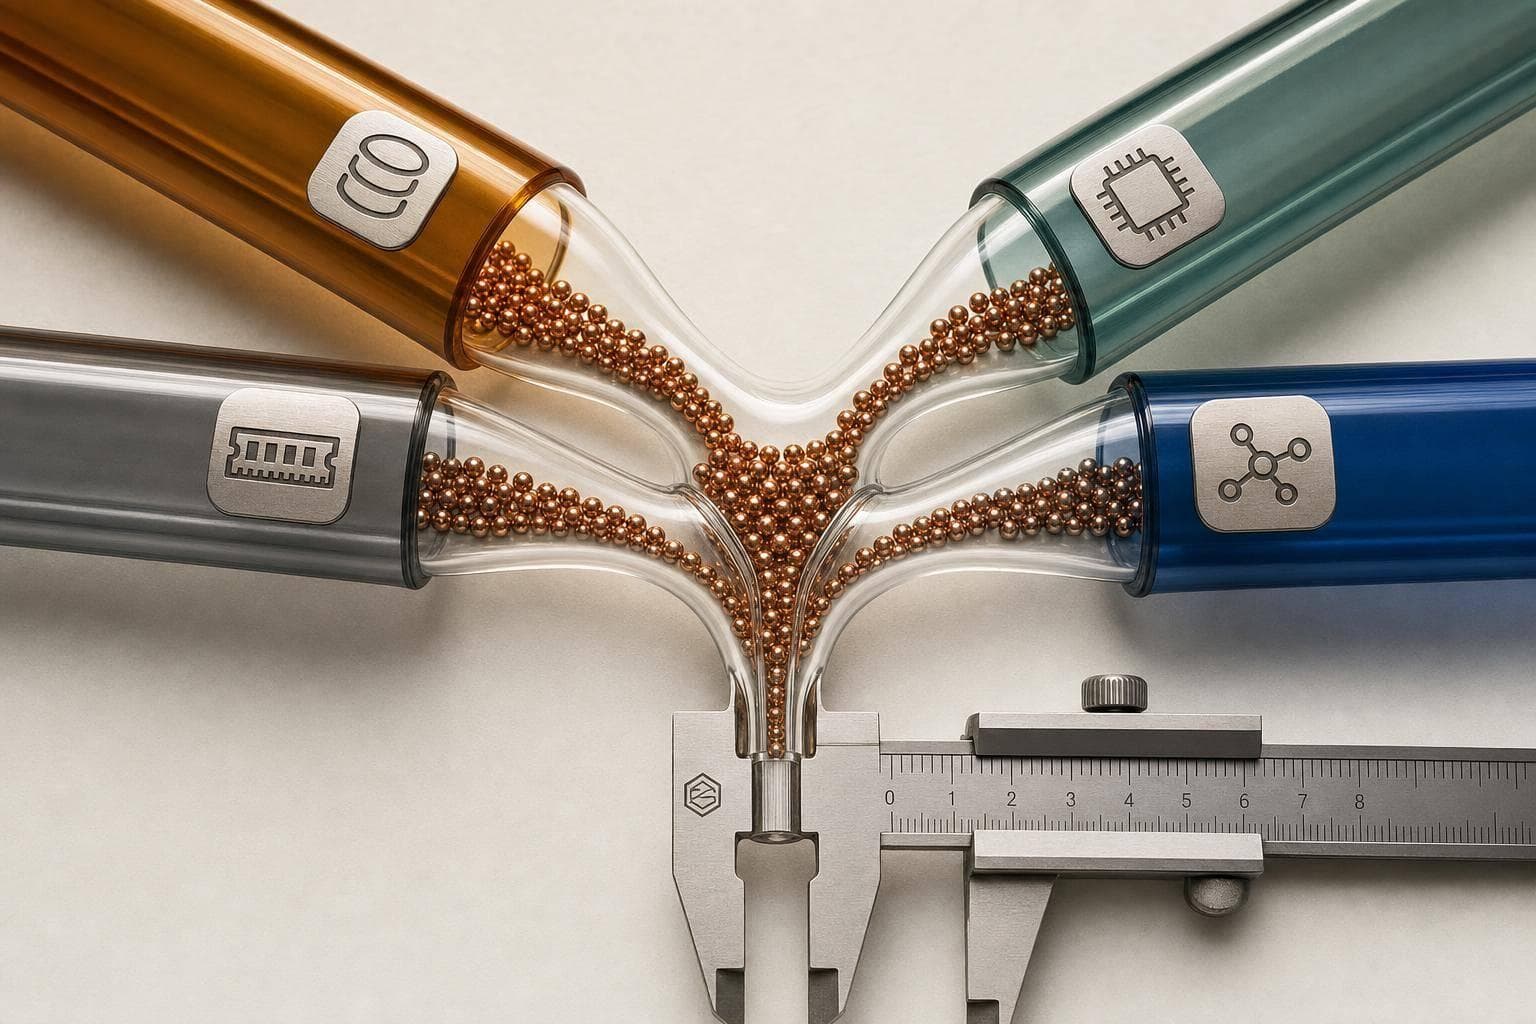
If I want a faster PyTorch run, I first find where time is going. In most cases, the slowdown falls into 4 buckets: data loading, compute, memory, or sync/communication. That matters because the fix for a data stall is very different from the fix for GPU sync or small-kernel overhead.
Here’s the short version:
- I start with
torch.utils.bottleneckfor a fast first check. - Then I use
torch.profilerto inspect CPU time, GPU time, idle gaps, and slow ops. - I skip startup noise with wait/warmup/active steps, often around 5–10 steps each.
- I look for clear signs:
- GPU idle gaps → data pipeline issue
- Many tiny kernels → Python or op-launch overhead
- OOM or tiny batch sizes → memory pressure
- Waits around
all_reduce→ distributed comms bottleneck
- I change one thing at a time and re-test throughput.
A few points stand out. Sync calls like .item(), .cpu(), and print(tensor) can stall the loop. torch.compile can improve steady-state speed by around 1.5x to 2x in some cases. And better compute/communication overlap has reached nearly 2x higher utilization in distributed training reports.
PROFILING AND OPTIMIZING PYTORCH APPLICATIONS WITH THE PYTORCH PROFILER | SABRINA SMAI

sbb-itb-903b5f2
Quick comparison
| Tool | What I use it for | What it shows best | When I stop and move on |
|---|---|---|---|
torch.utils.bottleneck | First-pass triage | Python vs. CUDA vs. input-side slowdown | When I need exact op or timeline detail |
torch.profiler | Main profiling pass | Operator timing, CPU/GPU split, memory, trace timeline | When I see a hotspot but not the hardware cause |
| Nsight Systems | System and CUDA runtime view | Threads, CUDA API overhead, timeline outside PyTorch | When one kernel still needs GPU-level analysis |
| Nsight Compute | Deep GPU kernel analysis | Occupancy, register pressure, launch shape | When the hotspot is one kernel and I need root cause |
My rule is simple: diagnose first, then tune. I use the trace pattern to pick the fix, not guesswork.
Core Tools for Profiling PyTorch Models
Use these tools in this order: torch.utils.bottleneck first, then torch.profiler, and only then Nsight, perf, or VTune if the bottleneck turns out to sit outside PyTorch. The idea is simple: start with a fast check, then dig deeper only if you need to.
torch.profiler: Operator, Memory, and Timeline Analysis
Use torch.profiler when the slowdown is happening inside PyTorch and you need operator-level timing. This is the main tool for seeing where time goes during a training step. It records a timeline of CPU ops and GPU kernel execution, so you can see which CPU calls launched which GPU kernels, plus how long each one took. In the trace, blocks show duration, and arrows connect CPU launches to GPU kernels.
Its settings let you trade detail for overhead. profile_memory tracks tensor allocations and deallocations, which helps when you're hunting for memory leaks or fragmentation. record_shapes stores input dimensions and strides, which is handy when a kernel looks slow because of an awkward tensor shape. with_stack maps each op back to a file and line in your code, but it adds a lot of overhead and makes trace files much larger, so turn it on only when you need to track down a specific op.
The schedule parameter matters a lot. A solid rule of thumb is to set wait and warmup to about 5–10 steps each before the active capture phase. That helps you skip noisy startup work and any one-time torch.compile overhead before recording begins. If you wrap code blocks with torch.profiler.record_function("label") - for example, "data_wait" or "forward" - those phases become much easier to spot in the trace. Also, call prof.step() at the end of every training-loop iteration so the profiler can tell where one step ends and the next starts.
| Profiling Setting | Purpose | Trade-off |
|---|---|---|
schedule | Sets wait, warmup, and active step counts | Skips initialization and compile warmup |
record_shapes | Captures input dimensions and strides | Adds some trace size; useful for kernel analysis |
with_stack | Correlates ops to file/line numbers | High overhead; increases trace file size a lot |
profile_memory | Tracks tensor memory allocation/deallocation | Needed to find memory leaks or fragmentation |
torch.utils.bottleneck: First-Pass Triage
Use this first when you want a quick read on whether the slowdown comes from Python, CUDA, or input handling. Run python -m torch.utils.bottleneck your_script.py. It gives you a fast signal about whether the script spends most of its time in Python, the autograd engine, or CUDA kernels. That tells you where to look next: Python, CUDA, or data loading.
This tool often points to GPU starvation caused by DataLoader stalls or too much Python work. It can also catch accidental sync points like .item(), print(tensor), or torch.cuda.synchronize() inside hot loops. What it can't do is map slow ops back to exact lines of code or show kernel-level hardware counters. That's the point where torch.profiler comes in.
When to Use Nsight, perf, or VTune
Move to lower-level tools only after a profiler trace shows the hotspot but still doesn't tell you why it's slow. If the PyTorch trace points to one kernel taking most of the time but doesn't explain the reason, Nsight Compute can show the hardware-side cause, such as SM occupancy, register pressure, or grid/block size.
Nsight Systems fits one step earlier. It's framework-agnostic, tends to have lower overhead than torch.profiler, and records OS-level thread activity plus CUDA API call overhead that PyTorch traces don't show.
Linux perf and Intel VTune are more about CPU counters and stall analysis, especially outside NVIDIA-heavy setups. In most PyTorch workflows, you won't need them unless you've traced the bottleneck all the way down to system-level contention or CPU microarchitecture behavior.
The Most Common Bottleneck Patterns
Once you’ve captured the trace, the next step is to sort the slowdown by the pattern you can actually see. Different bottlenecks leave different fingerprints in the trace, and that matters because the fix for one problem often does nothing for another.
Data Loading and Input Pipeline Delays
Long GPU idle gaps usually point to a stalled input pipeline. In plain English, the GPU is ready to work, but it’s sitting around waiting for data. A common fix is to set pin_memory=True and non_blocking=True when moving tensors to the GPU, bump up num_workers, and add persistent_workers=True so workers don’t restart at every epoch boundary.
Inefficient Operators, Python Overhead, and Low GPU Utilization
If the trace shows lots of small kernel launches instead of a few larger ones, kernel launch overhead is taking a bite out of compute time. Python loops over tensors make this worse because each loop iteration can trigger its own kernel launch. torch.compile can fuse those ops into optimized kernels and cut Python dispatch overhead. One example is swapping a hand-written attention loop for torch.nn.functional.scaled_dot_product_attention.
Sync calls inside the loop can also slow things down by forcing the host to wait. .item(), print(tensor), and torch.cuda.synchronize() show up as CPU wait gaps in the trace. A simple rule helps here: keep metric logging out of the hot loop, and only pull values to the CPU every N steps.
Memory Limits and Distributed Communication Overhead
Memory pressure often shows up as out-of-memory errors or batch sizes that are smaller than you’d like. Gradient checkpointing and mixed precision with torch.autocast plus bf16 or fp16 cut activation memory use and optimizer state size, which can make room for larger batches.
If you see gaps around all_reduce or FSDP gathers, communication is blocking compute. That’s a dead giveaway in distributed training. In a 2024 IBM and Meta run, overlapping communication with compute led to nearly 2x higher utilization.
The table below maps each trace pattern to its likely cause and usual fix:
| Bottleneck Type | Profiler Symptom | Likely Root Cause | Standard Optimization Path |
|---|---|---|---|
| Input Stall | Large idle gaps in GPU stream | Too few num_workers; expensive CPU transforms | Increase num_workers; use pin_memory; pre-decode data |
| Compute Bound | GPU busy but low throughput | Small batch size; unfused kernels | Enable AMP (bf16/fp16); torch.compile; increase batch size |
| Memory Bound | OOM errors; forced small batches | High activation memory; large optimizer states | Activation checkpointing; mixed precision; vocabulary padding |
| Sync Overhead | High CPU wait time | .item() or print() in loop; many tiny ops | Vectorize ops; remove sync calls; use CUDA Graphs |
| Communication | Gaps during all_reduce | Poor compute-communication overlap | Tune FSDP sharding; overlap gather with forward compute |
The key is simple: pick the fix from the trace signature, not from gut instinct.
A Step-by-Step Workflow for Diagnosing and Fixing Bottlenecks
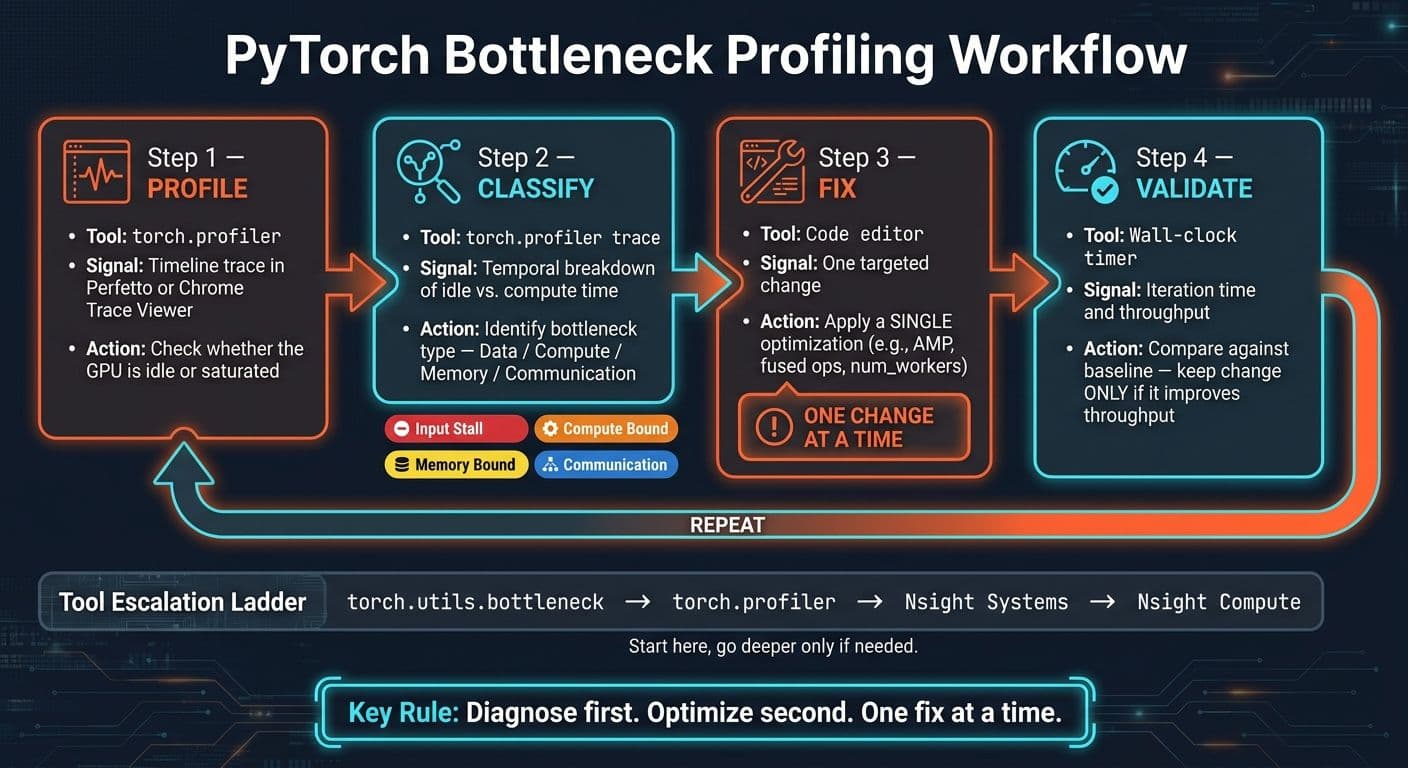
PyTorch Bottleneck Profiling Workflow: Diagnose Before You Optimize
Knowing the bottleneck patterns is only half the job. The other half is using the same process every time, so you’re not guessing which tweak made things better.
Profile a Representative Training or Inference Step
After you spot the main bottleneck types - data, compute, memory, and communication - run a strict loop: confirm the slowdown, isolate the cause, and test one fix at a time. Profile the exact workload you want to tune, with the same batch size and sequence length you plan to use in production.
Also, skip startup noise. Use torch.profiler.schedule with explicit wait, warmup, and active phases so the capture stays clean and automatic.
Classify the Slowest Phase Before Making Any Changes
Once you have a trace that matches your workload, classify the bottleneck before touching the code. Start with torch.utils.bottleneck to check whether the slowdown is happening on the Python side or the CUDA side. Then open the torch.profiler trace in Perfetto or Chrome Trace Viewer and confirm the pattern visually.
That visual check matters. A trace can tell you, at a glance, whether the GPU is sitting around idle, stuck waiting on data, or spending most of its time doing actual compute.
Apply 1 Fix, Then Re-Profile
This is where a lot of optimization work goes off the rails: people change three or four things at once, see a speedup, and have no idea what caused it. Don’t do that.
Change one thing. Re-profile. Keep the change only if it improves iteration time or throughput. That’s the whole loop, and it works best when each step maps to one clear measurement.
| Workflow Step | Tool Used | Signal Inspected | Likely Next Action |
|---|---|---|---|
| 1. Profile | torch.profiler | Timeline trace in Perfetto or Chrome | Check whether the GPU is idle or saturated |
| 2. Classify | torch.profiler trace | Temporal breakdown of idle vs. compute time | Identify whether the bottleneck is data, compute, memory, or communication |
| 3. Fix | Code editor | One targeted change | Apply a single optimization, such as AMP, fused ops, or num_workers |
| 4. Validate | Wall-clock timer | Iteration time and throughput | Compare against the baseline and keep the change only if it improves iteration time or throughput |
Key Takeaways and What to Watch Next
After classification comes action. The right fix depends on the bottleneck pattern in front of you. Most PyTorch slowdowns come back to three things: data stalls, sync overhead, or kernel inefficiency. Use torch.utils.bottleneck for a first pass, torch.profiler for trace-level detail, and then re-profile after each single change.
The main rule is simple: diagnose first, then optimize.
Points to Remember
Start with the easiest check before you open a trace. If torch.utils.bottleneck points to Python or autograd overhead, deal with that first. If the profiler trace shows large GPU idle gaps, the data pipeline needs work before kernel-level tuning will pay off. Splitting data-bound issues from compute-bound ones early can save a lot of time.
Test throughput on the actual workload, not a microbenchmark. Microbenchmarks can look great and still miss what happens in production. Real workloads tell you what’s slowing things down, and alignment plus fusion can lead to large gains.
Next, keep an eye on torch.compile. It cuts Python overhead and can make steady-state training 1.5x to 2x faster than uncompiled code. Fused attention through F.scaled_dot_product_attention reduces kernel launch overhead. And automated trace analysis tools can sort GPU idle time across multiple ranks, which beats reading raw traces by hand.
FAQs
How long should I profile for?
Profile long enough to get stable, consistent data after the noisy startup period. A common setup uses a wait phase, a warmup phase, and then active profiling. For example, you might wait 5 steps, warm up for 5 more, and then record the steps you want to inspect.
The warmup phase matters. The first 10 to 50 steps are often noisy, so if you profile too early, the numbers can mislead you. And if you use torch.compile, those early iterations are usually slower as well because of compilation overhead.
What should I fix first in a slow PyTorch run?
First, use the PyTorch Profiler to see exactly where time is going. Don’t guess. Profile first so you can focus on the actual bottleneck.
Then fix the specific issue:
- If the GPU is underused, improve data loading.
- If the job is compute-bound, use mixed precision,
torch.compile, or optimized kernels. - If the job is memory-bound, cut memory traffic.
If you use torch.compile, ignore the slower first iteration and measure steady-state performance.
When do I need Nsight instead of torch.profiler?
Start with torch.profiler. It’s the best first step when you want to connect PyTorch ops back to your code and see CPU and GPU timing in one place.
Then bring in NVIDIA Nsight Systems and Nsight Compute when you need a closer look at what’s happening inside the GPU at the kernel level.
That’s where Nsight helps most. After high-level profiling shows you where time is going, Nsight can show you lower-level bottlenecks like register use, shared memory occupancy, and specific CUDA events.